
Observability for AI Agents - Beyond the Logs
Go beyond traditional logs with modern AI agent observability. Trace LLM interactions, tool and MCP calls, latency, token usage, costs, failures, and outcomes to understand agent behavior, accelerate debugging, and build reliable production-ready AI systems.
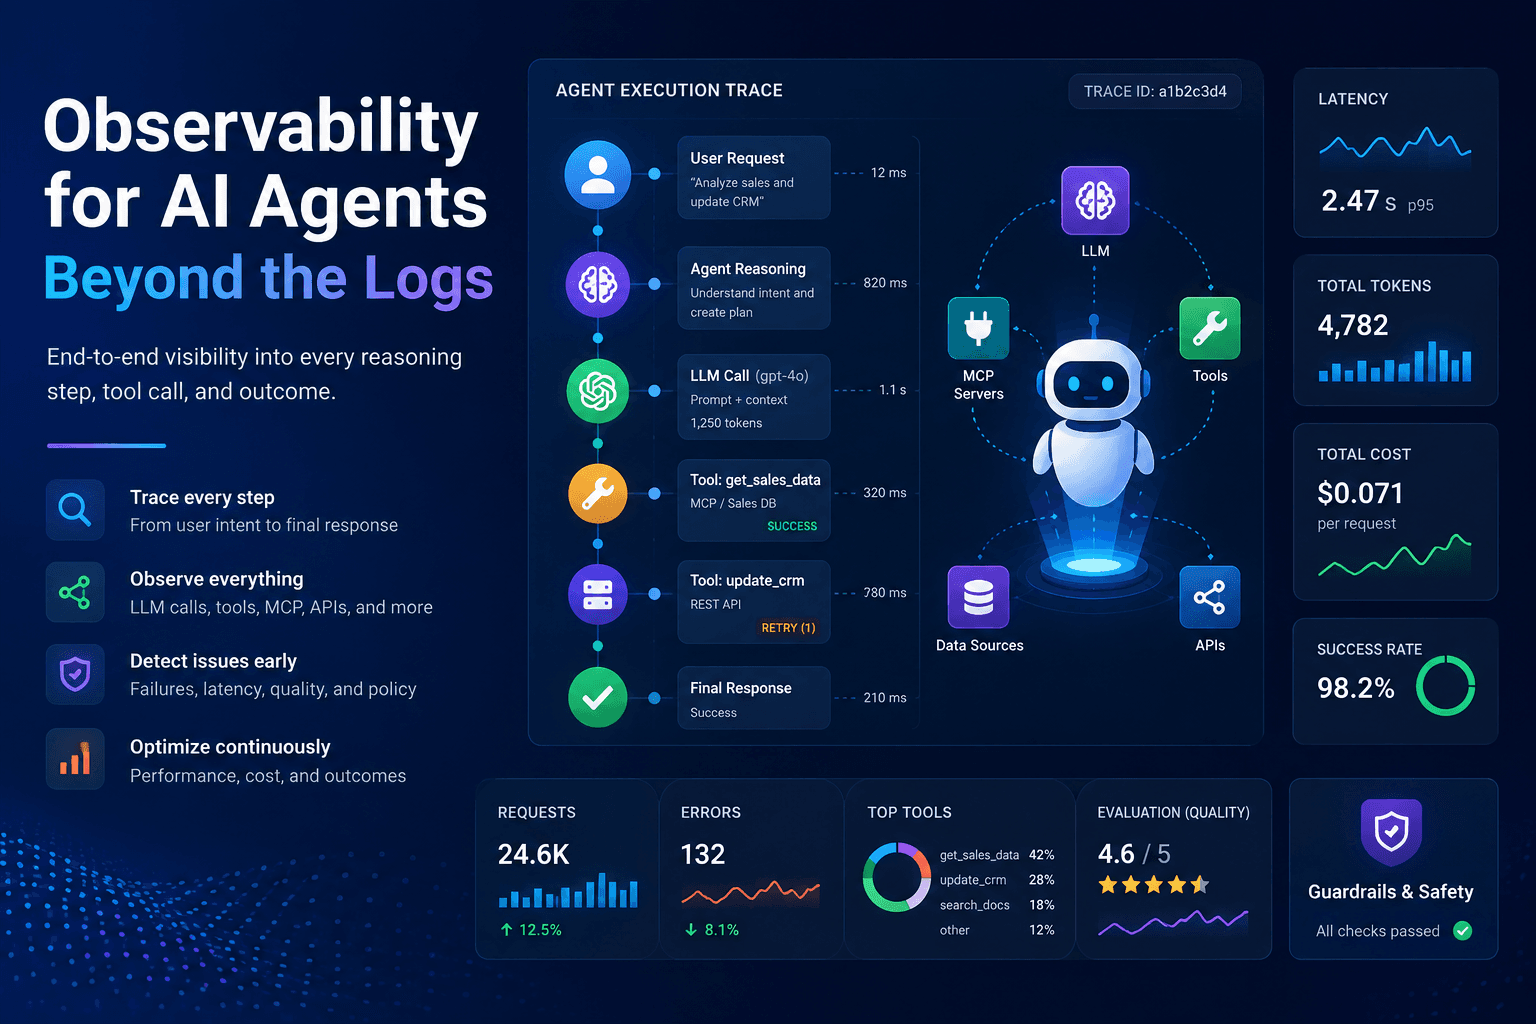
Observability for AI Agents — Beyond the Logs
AI applications are rapidly evolving from simple request-response interactions into autonomous and semi-autonomous agents capable of reasoning, planning, invoking tools, accessing external resources, collaborating with other agents, and executing multi-step workflows.
That evolution introduces a new operational challenge:
How do you understand what an AI agent actually did—and why?
Traditional application observability was built around logs, metrics, and traces. These signals remain essential, but they are no longer sufficient on their own. An agent can return a technically successful HTTP 200 response while still choosing the wrong tool, using incorrect context, entering an unnecessary reasoning loop, consuming excessive tokens, or producing an unacceptable outcome.
Modern AI systems therefore require a richer observability model—one that connects infrastructure telemetry with the semantic behavior of the agent.
From Application Observability to Agent Observability
Traditional observability typically answers questions such as:
- Did the request succeed?
- How long did it take?
- Which service failed?
- What exception was generated?
- How much CPU or memory was consumed?
Agent observability needs to go further.
It should help answer:
What was the agent trying to accomplish? Which model was used? What context influenced the response? Which tools were selected? Were the correct tool arguments generated? What happened during each step? How many model and tool calls were required? What did the workflow cost? Did the final result actually satisfy the user's goal?
The focus shifts from simply monitoring system health to understanding agent behavior and outcomes.
The Agent Execution Trace
A useful way to observe an AI agent is to treat every interaction as an end-to-end trace.
A typical execution might look like:
User Request → Agent → LLM → Planning → Tool Selection → MCP/API Call → Tool Response → LLM → Final Response
Each stage should become an observable span within the larger trace.
Instead of seeing disconnected log entries, engineers gain a structured timeline showing how the agent moved from intent to outcome.
For every execution, capture signals such as:
Identity and context: agent, session, conversation, workflow and trace identifiers.
Model telemetry: provider, model, latency, token consumption, retries, errors and estimated cost.
Tool telemetry: selected tool, sanitized arguments, execution duration, result status and failure details.
MCP telemetry: server, transport, capability, method, request/response metadata, protocol errors and latency.
Retrieval telemetry: query, retrieval source, document references, relevance information and context supplied to the model.
Outcome telemetry: completion status, evaluation scores, policy or guardrail results, user feedback and task success.
This creates a replayable execution history rather than a collection of isolated logs.
Observe the Entire Agent Lifecycle
Production-grade agent observability should cover several layers.
Traces and Spans
Distributed tracing provides the backbone.
One user interaction can produce multiple LLM requests, tool calls, retrieval operations, MCP requests and downstream API calls. Connecting them through a common trace makes it possible to identify exactly where latency, errors or unexpected behavior originated.
LLM Observability
Model calls should be treated as first-class operations.
Track model selection, response latency, input/output token usage, retries, rate limits, context size, structured-output failures and cost.
Where security and privacy policies allow it, prompts and responses can also be captured with appropriate redaction and access controls.
Tool and MCP Observability
Tool usage is one of the most important signals for agentic applications.
For every tool invocation, observe:
Agent → Tool → Input → Execution → Result → Agent
For MCP-based architectures, extend this visibility across servers, tools, resources and prompts. Capture protocol-level failures separately from application-level failures so teams can distinguish transport problems from incorrect agent decisions.
Agent Decisions
One of the biggest differences between deterministic software and agentic systems is that the execution path can change dynamically.
Observability should therefore expose useful decision metadata such as selected tools, routing decisions, workflow transitions, retries, fallback strategies and termination reasons.
The goal is not necessarily to expose hidden model reasoning. Instead, capture structured, operationally useful decision signals that explain the observable behavior of the system.
Cost and Performance
Agent workflows can become surprisingly expensive.
A single user request might trigger multiple model calls, retrieval operations and tool executions. Monitoring only total API spend makes optimization difficult.
Measure cost and performance at several levels:
Cost per request → Cost per trace → Cost per agent → Cost per model → Cost per tool → Cost per workflow
Combine these with latency distributions, token usage, cache effectiveness and tool execution times to identify expensive or inefficient execution patterns.
Logs Tell You What Failed. Traces Show You the Journey.
Consider an agent asked to retrieve information, analyze it and update another system.
The final operation fails.
Traditional monitoring might show:
500 — External API request failed
Agent observability could instead reveal:
Trace #A1842
User Request
↓
Agent interpreted request
↓
LLM Call — 820 ms
↓
Tool A selected
↓
MCP Server connected — 42 ms
↓
Tool A executed — Success
↓
LLM Call — 1.1 s
↓
Tool B selected
↓
Tool B arguments failed schema validation
↓
Agent retried Tool B
↓
External API returned 429
↓
Fallback attempted
↓
Workflow terminated
Now the engineering team can understand not only that the operation failed, but how the agent arrived at the failure.
Evaluations Complete the Picture
An agent can execute without exceptions and still produce a poor result.
That makes evaluations an important extension of observability.
Production systems can combine operational telemetry with evaluations for dimensions such as:
- Task completion
- Response quality
- Tool-selection accuracy
- Groundedness
- Retrieval relevance
- Safety and policy compliance
- Structured-output correctness
- Latency and cost efficiency
This creates a powerful connection between system performance and AI quality.
OpenTelemetry and Emerging Standards
As AI architectures mature, teams should avoid creating isolated observability silos wherever possible.
OpenTelemetry provides a strong foundation for correlating traces, metrics and logs across applications, infrastructure, model gateways and agent workflows. Emerging semantic conventions for generative AI can further standardize how model and agent operations are represented.
For MCP-based ecosystems, the same philosophy applies: propagate correlation and trace context across the MCP client, server, tools and downstream services whenever the
More from the blog
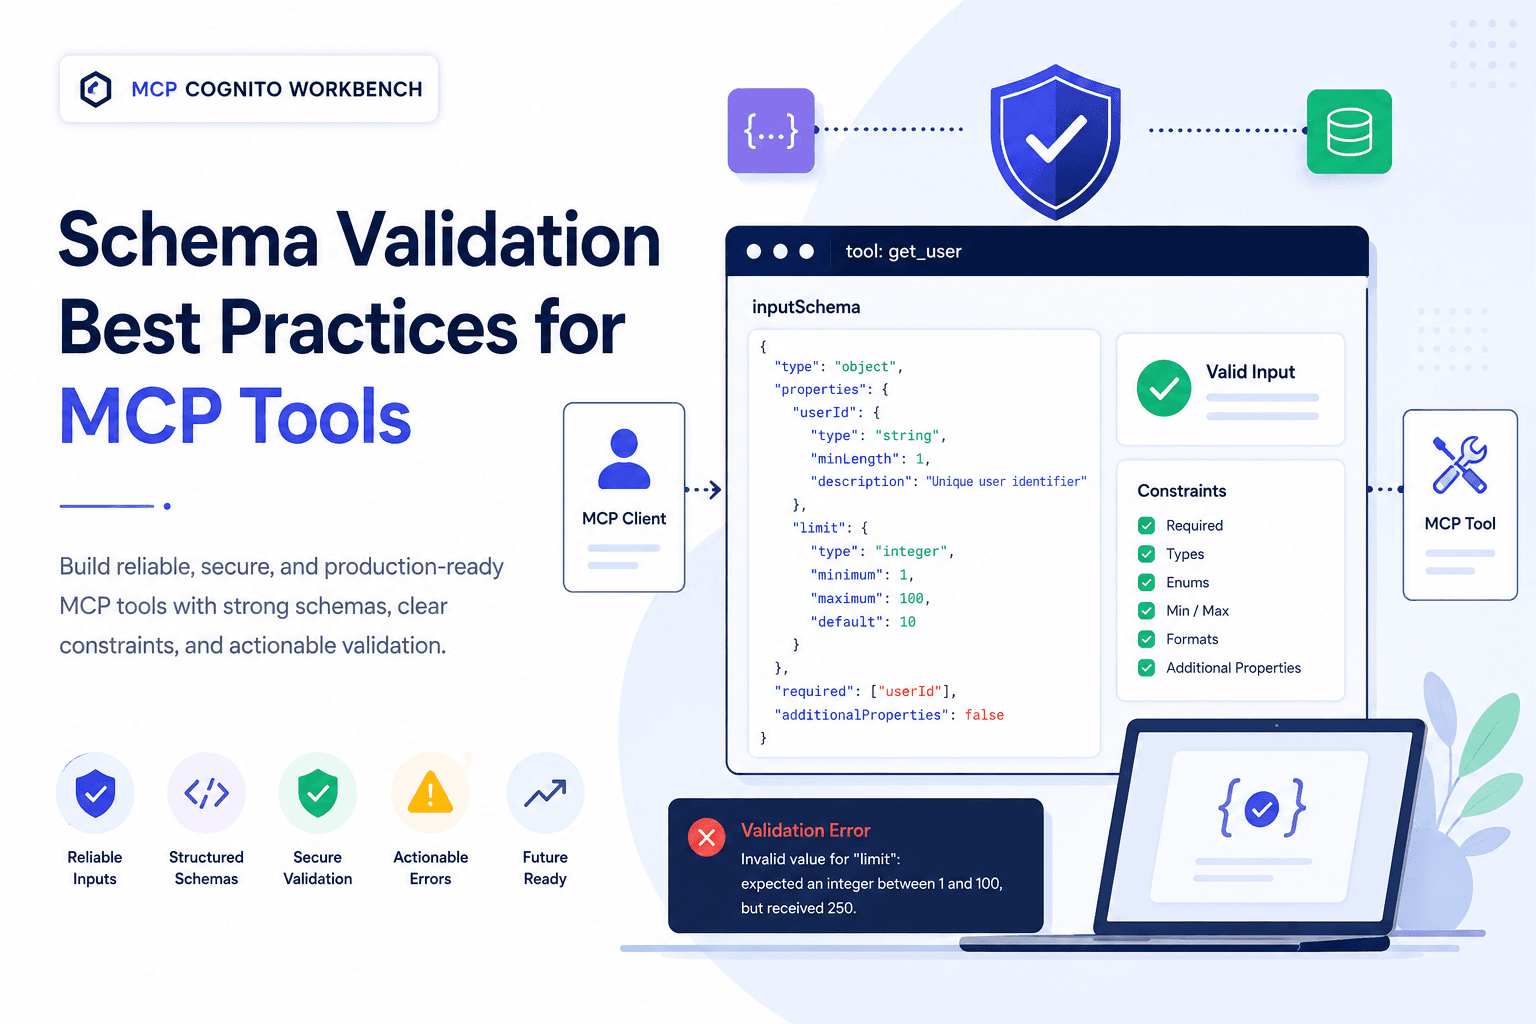
Schema Validation Best Practices for MCP Tools
Build reliable, secure, and production-ready MCP tools with robust schema validation. Explore best practices for input constraints, structured outputs, actionable errors, security, compatibility, and testing to create predictable, interoperable MCP integrations.
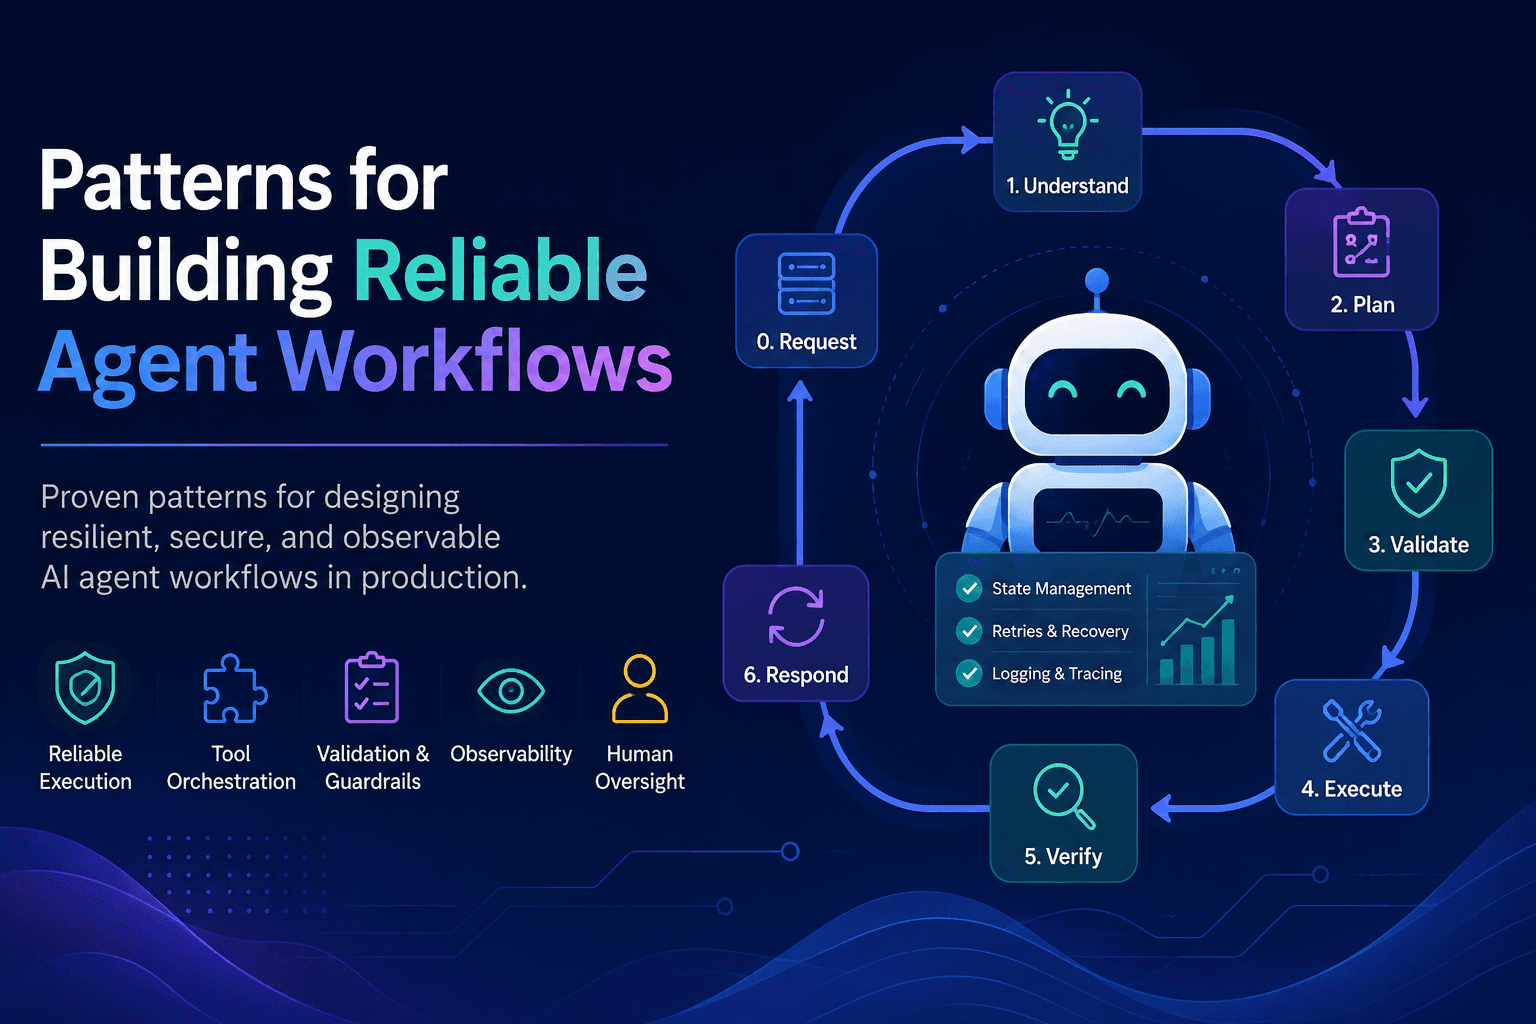
Patterns for Building Reliable Agent Workflows
Discover proven patterns for building reliable AI agent workflows with structured planning, safe tool use, validation, retries, observability, state management, and human oversight—designed for resilient, production-ready agent systems.
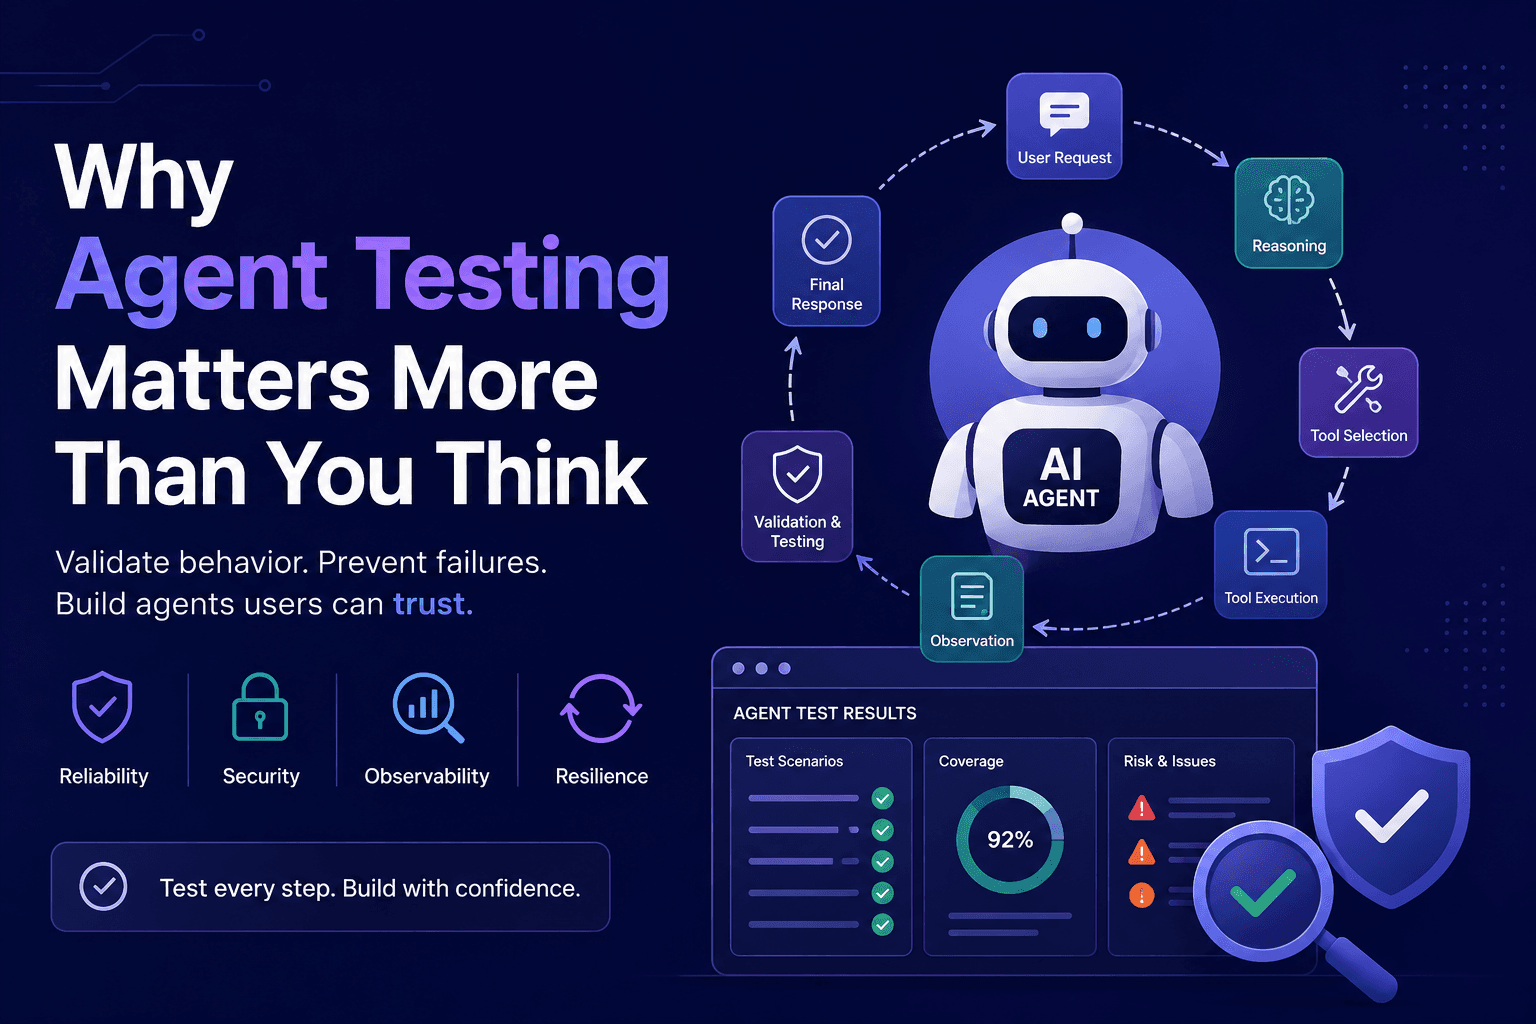
Why Agent Testing Matters More Than You Think
AI agents can reason, call tools, and act across systems—but that autonomy creates new risks. Discover why agent testing is essential for validating behavior, failures, security, MCP workflows, and real-world reliability before production.